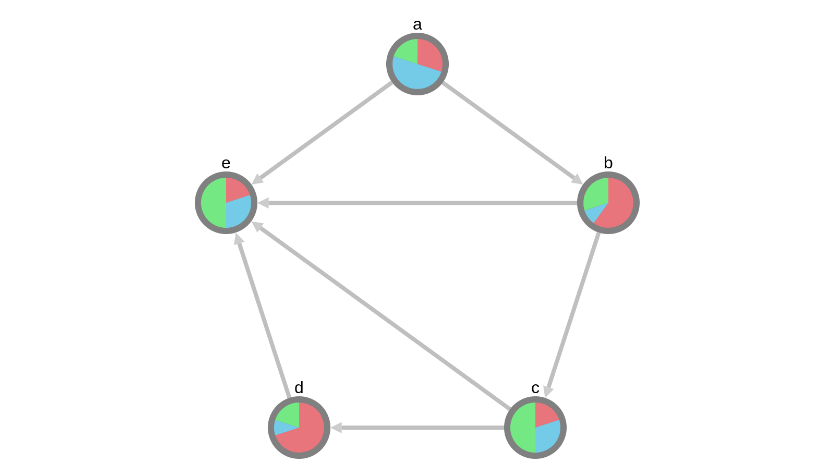
Pie Style
This graph is a demo showing the implementation of pie charts within the nodes. You can construct this graph in graphspace_python by the following steps:
Importing necessary modules
You have to import the GSGraph
class to construct a graph and GraphSpace client
class to upload the graph to GraphSpace.
>>> from graphspace_python.graphs.classes.gsgraph import GSGraph
>>> from graphspace_python.api.client import GraphSpace
Initialize GraphSpace client
You have to initialize the GraphSpace client by providing your username and password.
>>> graphspace = GraphSpace('user1@example.com', 'user1')
Set name,tags and visibility status
Using the mothods of the GSGraph class you can set name, tags and visibility status for your newly created graph.
>>> G.set_name('Pie Style')
>>> G.set_tags(['pie-style', 'pie', 'graphspace', 'demo'])
>>> G.set_is_public()
Define meta-data
Meta data for the graph can be set in the following way:
>>> data = {
>>>     'description': 'A demo network where the nodes constitute of pie charts.<br>You can also view this demo graph at:\
>>>  <a href=\"http://js.cytoscape.org/demos/pie-style/\">http://js.cytoscape.org/demos/pie-style/</a>',
>>>     'directed': True
>>> }
>>> G.set_data(data)
Adding nodes to the graph
You can add nodes to the graph using the add_node()
method available in the GSGraph class.
>>> G.add_node('a', {"foo": 3, "bar": 5, "baz": 2})
>>> G.add_node('b', {"foo": 6, "bar": 1, "baz": 3})
>>> G.add_node('c', {"foo": 2, "bar": 3, "baz": 5})
>>> G.add_node('d', {"foo": 7, "bar": 1, "baz": 2})
>>> G.add_node('e', {"foo": 2, "bar": 3, "baz": 5})
Set node positions
After adding the nodes you can set their positions(x,y coord) in the following way:
>>> G.set_node_position('a', y=60, x=550.5)
>>> G.set_node_position('b', y=193.2, x=733.8)
>>> G.set_node_position('c', y=408.6, x=663.8)
>>> G.set_node_position('d', y=408.6, x=437.2)
>>> G.set_node_position('e', y=193.2, x=367.2)
Adding edges to the graph
You can add edges to the graph using the add_edge()
method available in the GSGraph class.
>>> G.add_edge('a', 'e', {'weight': 1})
>>> G.add_edge('a', 'b', {'weight': 3})
>>> G.add_edge('b', 'e', {'weight': 4})
>>> G.add_edge('b', 'c', {'weight': 5})
>>> G.add_edge('c', 'e', {'weight': 6})
>>> G.add_edge('c', 'd', {'weight': 2})
>>> G.add_edge('d', 'e', {'weight': 7})
Set styling for the graph elements
You can assign style to the added nodes and edges in the following manner:
>>> G.add_style('node', {
>>>     "width": "60px",
>>>     "height": "60px",
>>>     "content": "data(id)",
>>>     "pie-size": "80%",
>>>     "pie-1-background-color": "#E8747C",
>>>     "pie-1-background-size": "mapData(foo, 0, 10, 0, 100)",
>>>     "pie-2-background-color": "#74CBE8",
>>>     "pie-2-background-size": "mapData(bar, 0, 10, 0, 100)",
>>>     "pie-3-background-color": "#74E883",
>>>     "pie-3-background-size": "mapData(baz, 0, 10, 0, 100)",
>>>     "background-color": "grey",
>>>     "text-valign": "top"
>>> })
>>> G.add_style('edge', {
>>>     "curve-style": "bezier",
>>>     "width": 4,
>>>     "target-arrow-shape": "triangle",
>>>     "opacity": 0.5,
>>>     "line-color": "grey"
>>> })
Upload graph to GraphSpace
Finally, you can upload the graph to GraphSpace.
>>> graph = graphspace.post_graph(G)
>>> graph.url
'http://graphspace.org/graphs/32708'
This demo graph is already present on GraphSpace. You can view it at http://graphspace.org/graphs/22755